A few months ago, I wrote about the importance of good habitat digitising and why the way we draw habitat boundaries matters. Since then, I've had a number of conversations with ecologists, GIS professionals and local authorities about habitat mapping standards, you can access it here.
In this edition I want to show you what these errors look like and how easy they are to miss. I have an example of some digitised polygons that appear to be symbolised by habitat type with clear boundaries. The challenge is that many of the most significant data quality issues aren't visible from a map like this. The habitat map may look professional, complete and entirely credible, but hidden within the underlying GIS data there can be errors that affect calculations, ownership boundaries, long-term monitoring and confidence in the results.
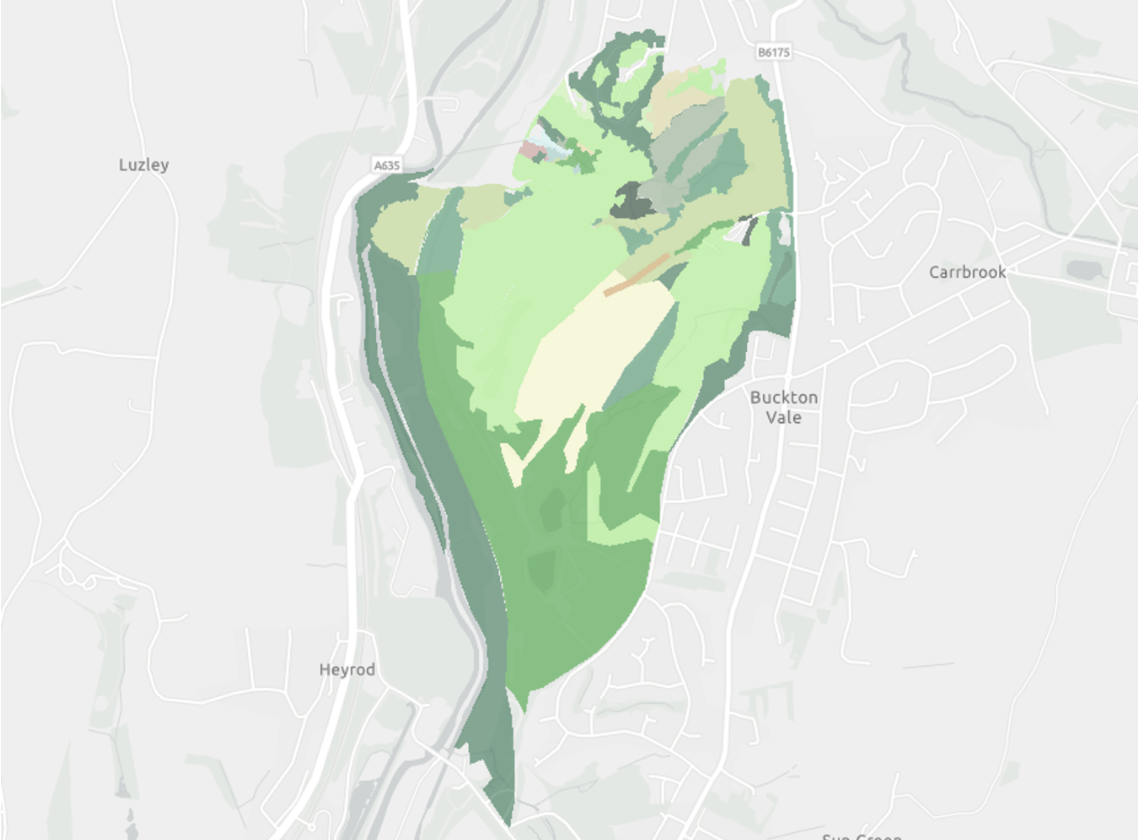
The examples shown here highlight four issues that appear regularly in habitat datasets. None of them are particularly unusual, but all of them have the potential to create problems further down the line.
-
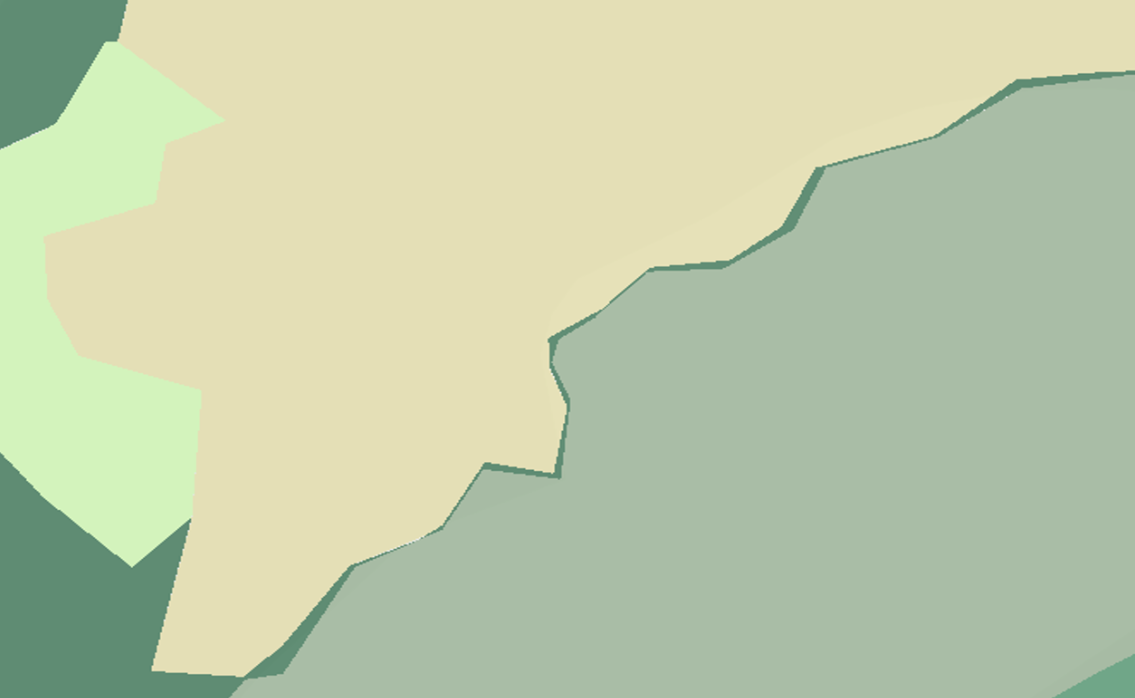
• The same area may be counted multiple times
• Can artificially inflate biodiversity unit calculations
• Creates inconsistencies between habitat mapping and supporting evidence
• Overlaps are not easily seen on a habitat map and may go unnoticed
Every part of a site should belong to a single habitat parcel. When two polygons overlap, the same area of land is effectively recorded twice. Depending on the habitat involved, that overlap may have a direct impact on area calculations and subsequently on biodiversity units. Without a tool to assess overlaps, they are nearly impossible to see.
-
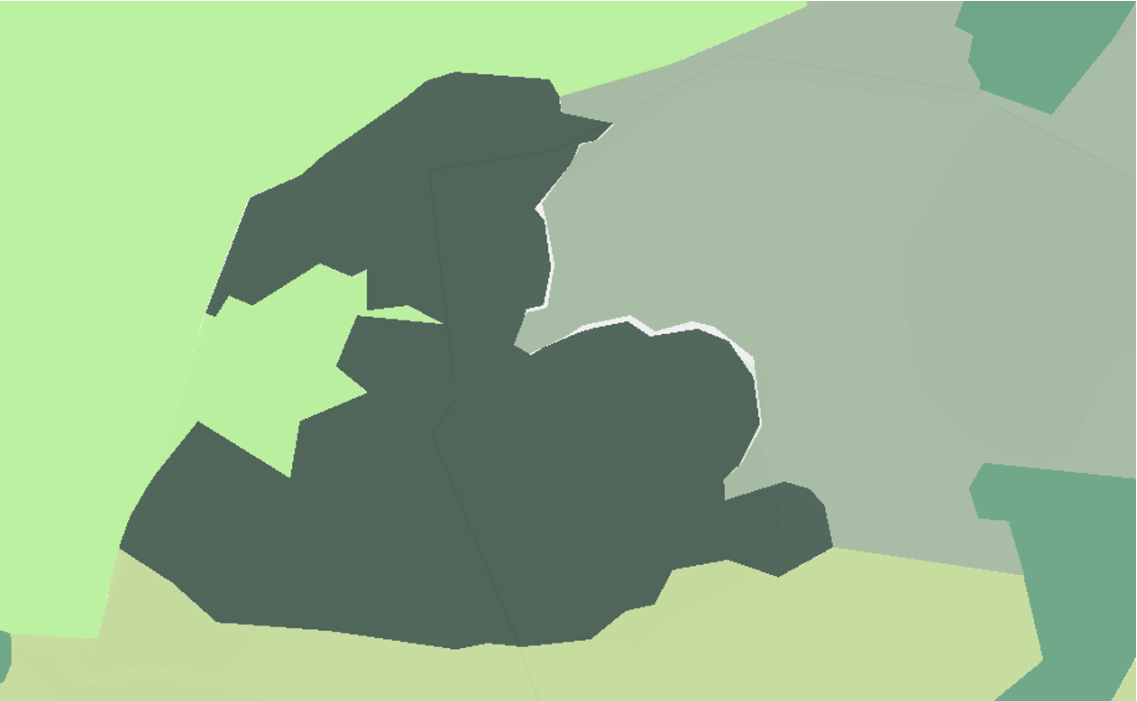
• Unmapped areas create uncertainty in habitat extent calculations
• Biodiversity units may be omitted from baseline or post-dev assessments
• Can lead to underestimation of ecological value
• Poor practice in digitising
These are often very small and can be difficult to spot visually, especially on larger sites. However, if habitat mapping is intended to represent complete site coverage, gaps mean there are areas of land that have not been assigned a habitat classification at all. In some cases, they amount to only a few square metres. In others they can represent much larger omissions.
-
• Habitat parcels not assigned a habitat type or condition
• Biodiversity units incorrectly calculated
• Reduces transparency and confidence in ecological assessments
• Creates uncertainty around the baseline and post-dev habitat values
A polygon may have been digitised correctly, but that does not necessarily mean it has been classified correctly. Habitat classifications that do not align with survey evidence create a different type of data quality problem. The geometry looks fine, but the attributes tell a different story. To add to this, the habitats have not been symboloised using the UKHabs symbology.
-
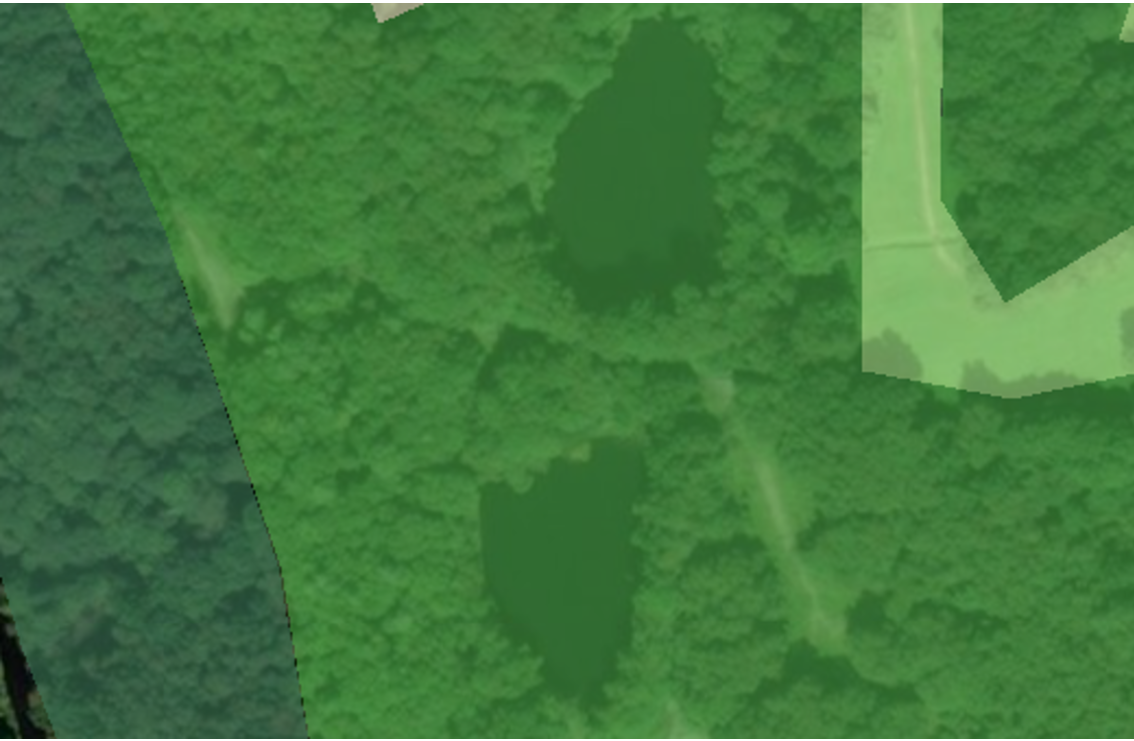
• Habitat areas extend beyond known ownership boundaries
• Biodiversity units may be attributed to land outside of legal control
• Creates potential ownership and liability disputes
• Not visible from a simple habitat map
Here we have habitat data extending beyond Land Registry ownership boundaries. Again, this isn't something that would necessarily jump out from a habitat map or planning report. However, it raises important questions about legal control, management responsibility, and whether biodiversity units are being attributed to land that sits outside the applicant's ownership.
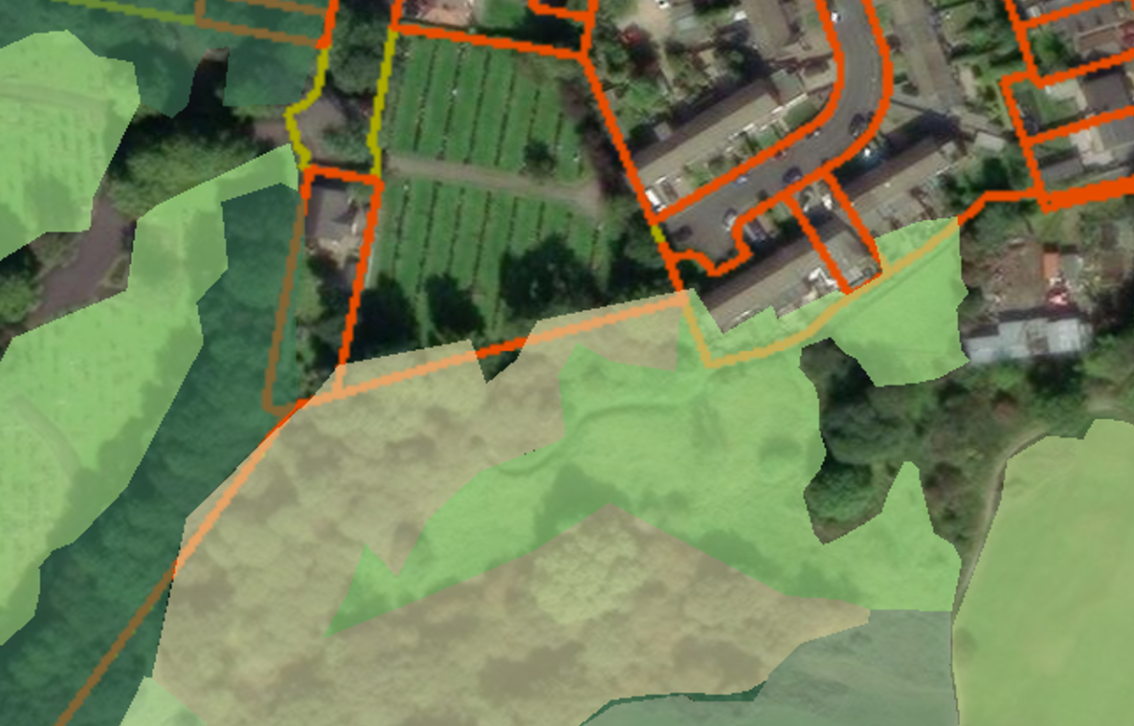
Individually, none of these issues sound particularly dramatic. The problem is that habitat maps rarely exist in isolation. They sit alongside Biodiversity Metrics, planning applications, Habitat Management and Monitoring Plans, habitat bank registrations and future monitoring surveys. Once a dataset starts being reused, copied between organisations and updated over time, small inconsistencies can become much harder to track down and resolve.
This is one of the reasons FRIDAS looks beyond habitat classification alone. A habitat map might look reasonable on first inspection, but if the polygons overlap, contain gaps, don't align with site boundaries or include incorrect attributes, confidence in the wider dataset starts to fall away.
The encouraging part is that most of these issues are entirely avoidable. Good digitising standards, sensible QA checks and a few extra minutes reviewing the final output will identify the vast majority of them before the data ever leaves the GIS.
Please remember that as BNG matures, there will quite rightly continue to be scrutiny of habitat classifications, condition assessments and biodiversity calculations. The habitat map deserves the same level of attention. After all, every number in the metric starts with a polygon on a map.